AI Image Prompt:
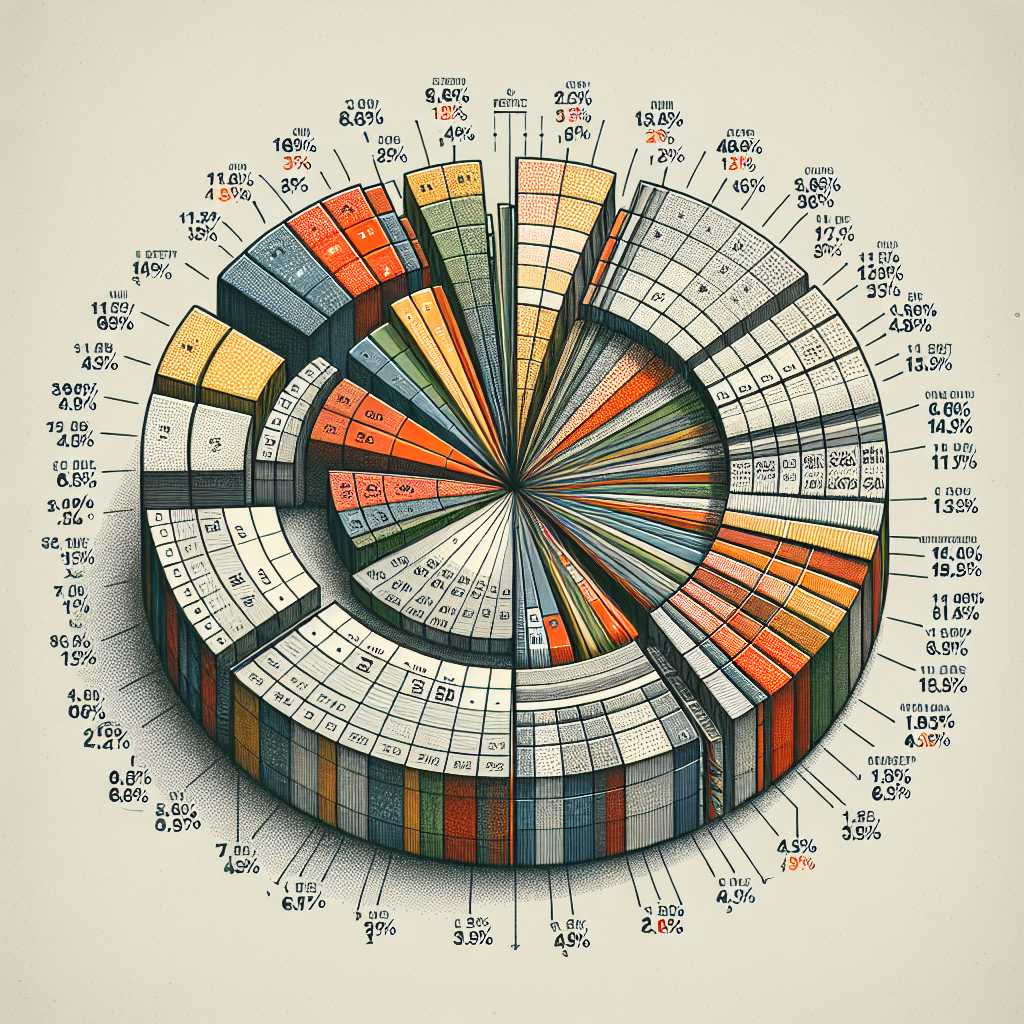
A detailed pie chart with 10 individual slices each representing a specific percentage. The pie chart slices are quite dynamic in size, signifying an array of different percentage distributions. The slices percentages are as follows: the first slice represents 17.36%, the second slice represents 8.67%, the third slice represents 13.87%, the fourth slice represents 10.40%, the fifth slice represents 20.80%, the sixth slice represents 10.40%, the seventh slice represents 6.93%, the eighth slice represents 12.15%, the ninth slice represents 3.47% and the last slice represents 6.38%. The chart’s numbers labels are clear and easy to read, to help illustrate the distribution of percentages effectively.